Remote Debugger Setup
FlowMVI comes with a remote debugging setup with a dedicated Jetbrains IDEs / Android Studio plugin and a desktop app for Windows, Linux, and MacOS.
Step 1: Install the plugin on debug builds only
It pollutes your app with unnecessary code, introduces serious security risks and degrades performance. If possible on your platform, don't include the debugging code in the release build or use minification/obfuscation to remove the debugging code.
1.1 Set up a module for store configurations
To keep the source set structure simple, you can create a separate module for your store configuration logic and then inject configurations using DI.
First, create a separate module where you'll keep the Store configuration.
<project_root>/
├─ common-arch/
│  ├─ src/
│  │  ├─ androidDebug/
│  │  │  ├─ InstallDebugger.kt
│  │  ├─ commonMain/
│  │  │  ├─ InstallDebugger.kt
│  │  ├─ nativeMain/
│  │  │  ├─ InstallDebugger.kt
│  │  ├─ androidRelease/
│  │  │  ├─ InstallDebugger.kt
|  ├─ build.gradle.kts
dependencies {
    debugImplementation(libs.flowmvi.debugger) // android Debug (name is incorrect on the kotlin plugin side)
    nativeMainImplementation(libs.flowmvi.debugger) // other platforms
    implementation(libs.flowmvi.core)
}
1.2 Set up source set overrides
Now we're going to create an expect-actual fun to:
- Install the real remote debugger in
androidDebugsource set - Do nothing in
androidReleasesource set - Conditionally install the debugger on other platforms where build types are not supported.
// commonMain -> InstallDebugger.kt
expect fun <S : MVIState, I : MVIIntent, A : MVIAction> StoreBuilder<S, I, A>.remoteDebugger()

// androidDebug -> InstallDebugger.kt
actual fun <S : MVIState, I : MVIIntent, A : MVIAction> StoreBuilder<S, I, A>.remoteDebugger(
) = install(debuggerPlugin())

// androidRelease -> InstallDebugger.kt
actual fun <S : MVIState, I : MVIIntent, A : MVIAction> StoreBuilder<S, I, A>.remoteDebugger() = Unit

// conditional installation for other platforms:
actual fun <S : MVIState, I : MVIIntent, A : MVIAction> StoreBuilder<S, I, A>.remoteDebugger() {
    enableRemoteDebugging()
}
As of the date of writing, the Android Studio will not index the androidRelease source set correctly, but it will
be picked up by the compiler. We'll have to resort to "notepad-style coding" for that set unfortunately.
1.3 Set up store configuration injection
If you're building a small pet project, you may omit this complicated setup and just use a simple extension if you know the risks you are taking.
Set up config injection using a factory pattern using your DI framework:
interface ConfigurationFactory {

    operator fun <S : MVIState, I : MVIIntent, A : MVIAction> StoreBuilder<S, I, A>.invoke(name: String)
}

inline fun <reified S : MVIState, I : MVIIntent, A : MVIAction> StoreBuilder<S, I, A>.configure(
    configuration: StoreConfiguration,
    name: String,
) = with(configuration) {
    invoke(name = name)
}
You can also use this to inject other plugins, such as the Saved State plugin or your custom plugins.
Now we'll create a configuration factory. You can create more based on your needs, such as for testing stores or app flavors.
internal class DefaultConfigurationFactory(
    analytics: Analytics,
) : ConfigurationFactory {

    override operator fun <S : MVIState, I : MVIIntent, A : MVIAction> StoreBuilder<S, I, A>.invoke(
        name: String,
    ) {
        configure {
            this.name = name
            debuggable = BuildFlags.debuggable // set up using an expect-actual
            actionShareBehavior = ActionShareBehavior.Distribute()
            onOverflow = SUSPEND
            parallelIntents = true
            logger = CustomLogger
        }
        enableLogging()
        enableRemoteDebugging()

        install(analyticsPlugin(analytics)) // custom plugins
    }
}
Finally, inject your config:
internal class CounterContainer(
    configuration: ConfigurationFactory,
) : Container<State, Intent, Action> {

    override val store = store(Loading) {
        configure(configuration, "Counter")
    }
}
Setting up injection is covered in the DI Guide
Step 2: Connect the client on Android
You can skip this step if you don't target Android
On all platforms except Android, we can just use the default host and port for debugging (localhost). But if you use an external device or an emulator on Android, you need to configure the host yourself.
For emulators, the plugin will use the emulator host by default (10.0.2.2). We will need to allow cleartext traffic on
that host and our local network hosts
In your common-arch module we created earlier, or in the app module, create a network security configuration
for debug builds only.
<manifest xmlns:android="http://schemas.android.com/apk/res/android"
        xmlns:tools="http://schemas.android.com/tools">

    <application android:networkSecurityConfig="@xml/network_security_config"
            tools:node="merge">

    </application>

</manifest>
<?xml version="1.0" encoding="utf-8"?>
<network-security-config>
    <domain-config cleartextTrafficPermitted="true">
        <domain includeSubdomains="true">10.0.2.2</domain>
        <domain includeSubdomains="true">192.168.*</domain>
    </domain-config>
</network-security-config>
Please don't do this for release builds.
Step 3.1: Install and run the debugger app for a single device
Either install the IDE plugin by clicking the card on top, or install the desktop app from the Artifacts section of the repository. You can find the latest archive on the releases page on GitHub.
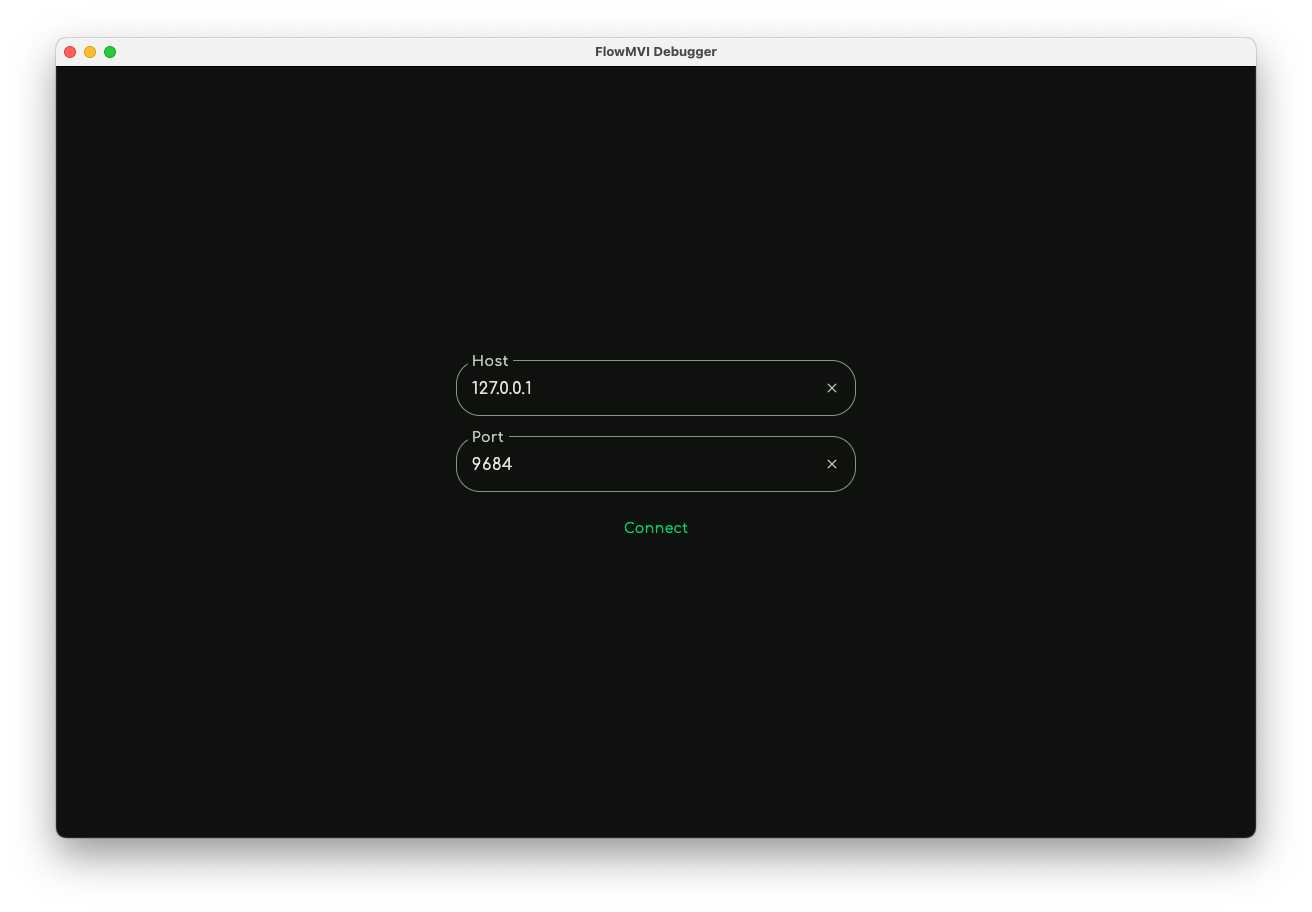
Run the debugger. The panel will ask you to configure host and port. Unless you are using a physical external device, you can just use the defaults. Your devices must be on the same network to connect successfully.

Run the server and the client, or click the panel icon in the IDE. After a few seconds, your devices should connect and you can start debugging.
Step 3.2 External device configuration
If you are connected to an external device via ADB that is on the same network, you can set up the debugger to work with that. The setup is a little bit more complicated, but in short, it involves:
- Assign a static IP address to both your PC and development device on your Wi-Fi network for convenience.
- Use the IP address of your PC as the host address when running the debugger plugin.
- Provide the IP address of the PC to the debugger store plugin (in the code) to let it know to which address to connect to using the plugin parameters.
- Make sure the debugging port you are using is open on both devices.